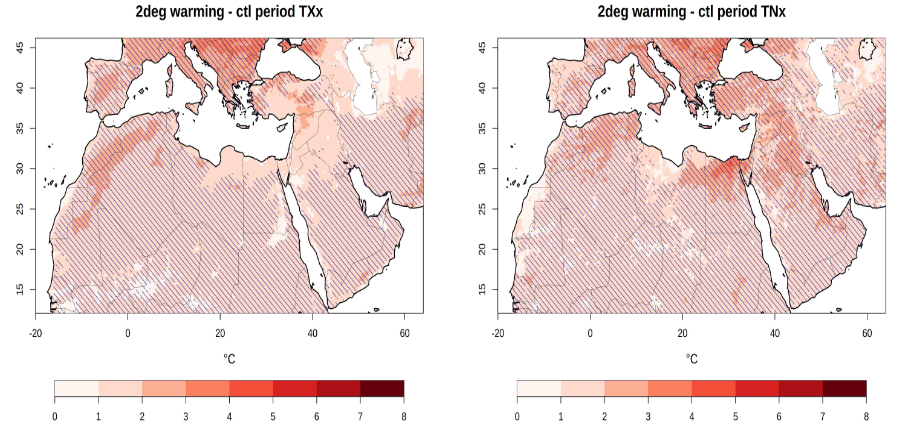
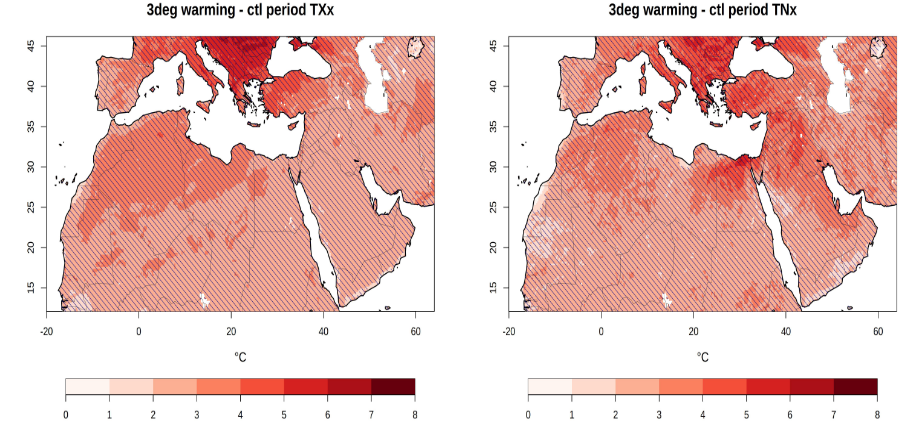
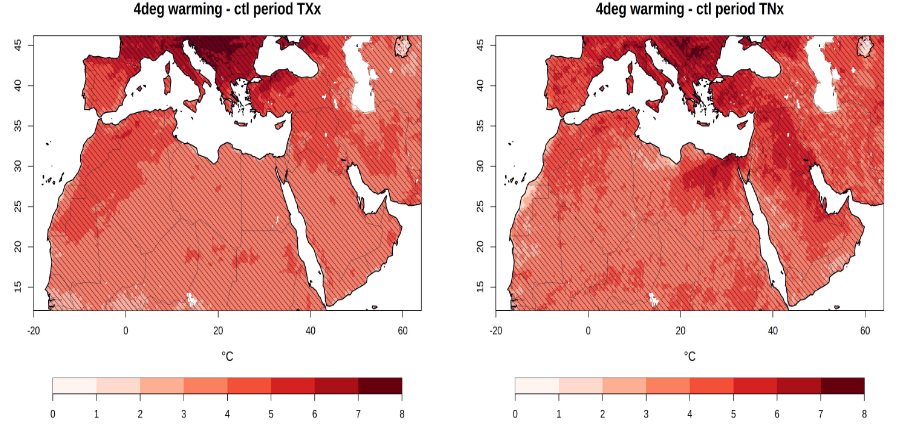
Below: Projected temporally averaged changes in the Warmest Day (TXx, left) and the Warmest Night (TNx, right) under different global warming levels displayed as differences (in °C) relative to the reference period (1986-2005) simulated by the WRF model. The hatching represents significant changes.
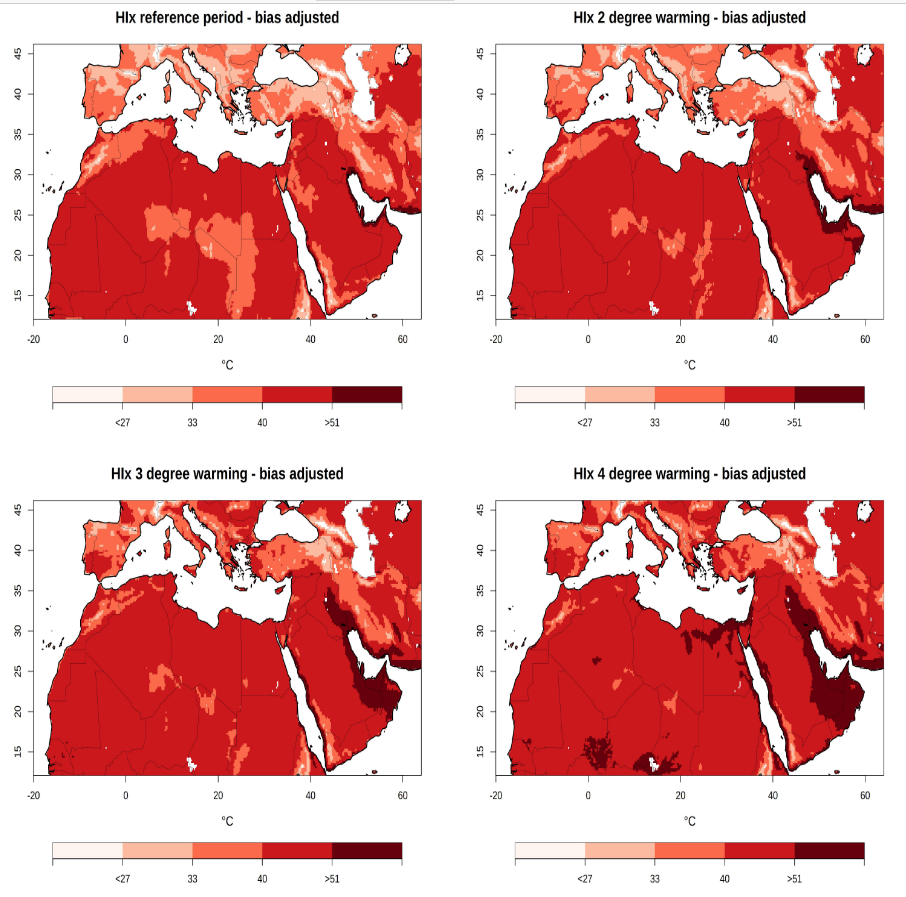
Below: Spatial representation of the bias-adjusted mean annual maximum of the Heat Index (HIx) for the reference period (1986-2005) ans under different global warming levels, simulated by the WRF model.
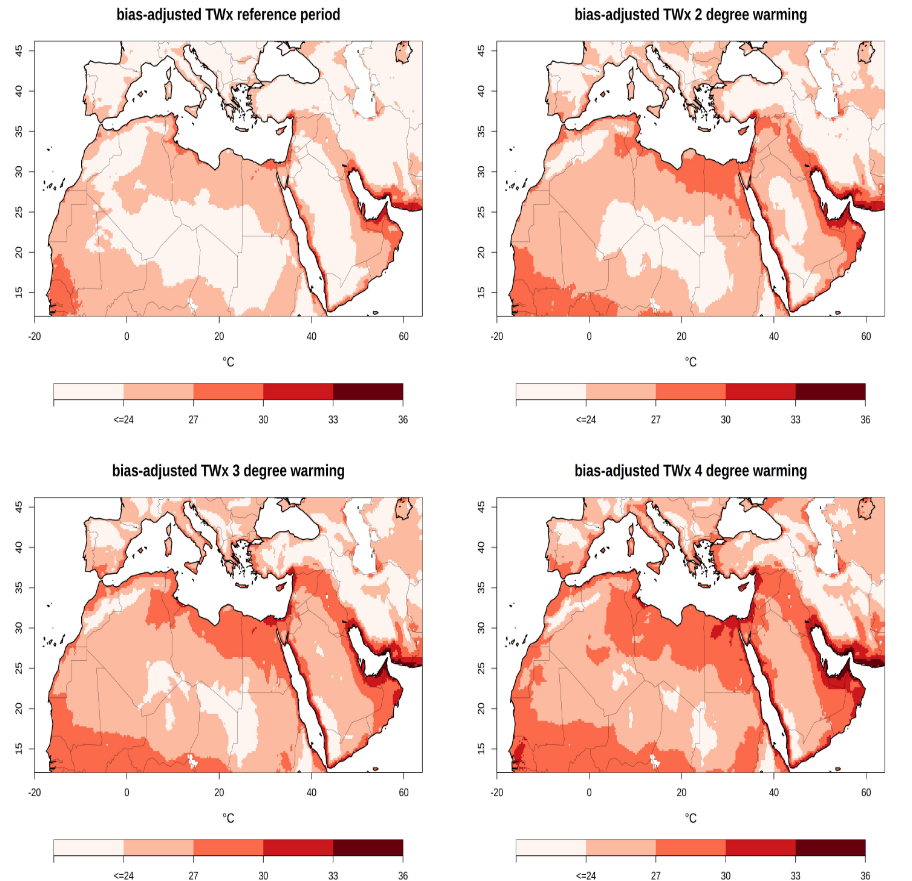
Below: Spatial representation of the bias-adjusted mean annual maximum of the Wet Bulb temperature (TWx) for the reference period (1986-2005) and under different global warming levels, simulated by the WRF model.
