NICOSIA
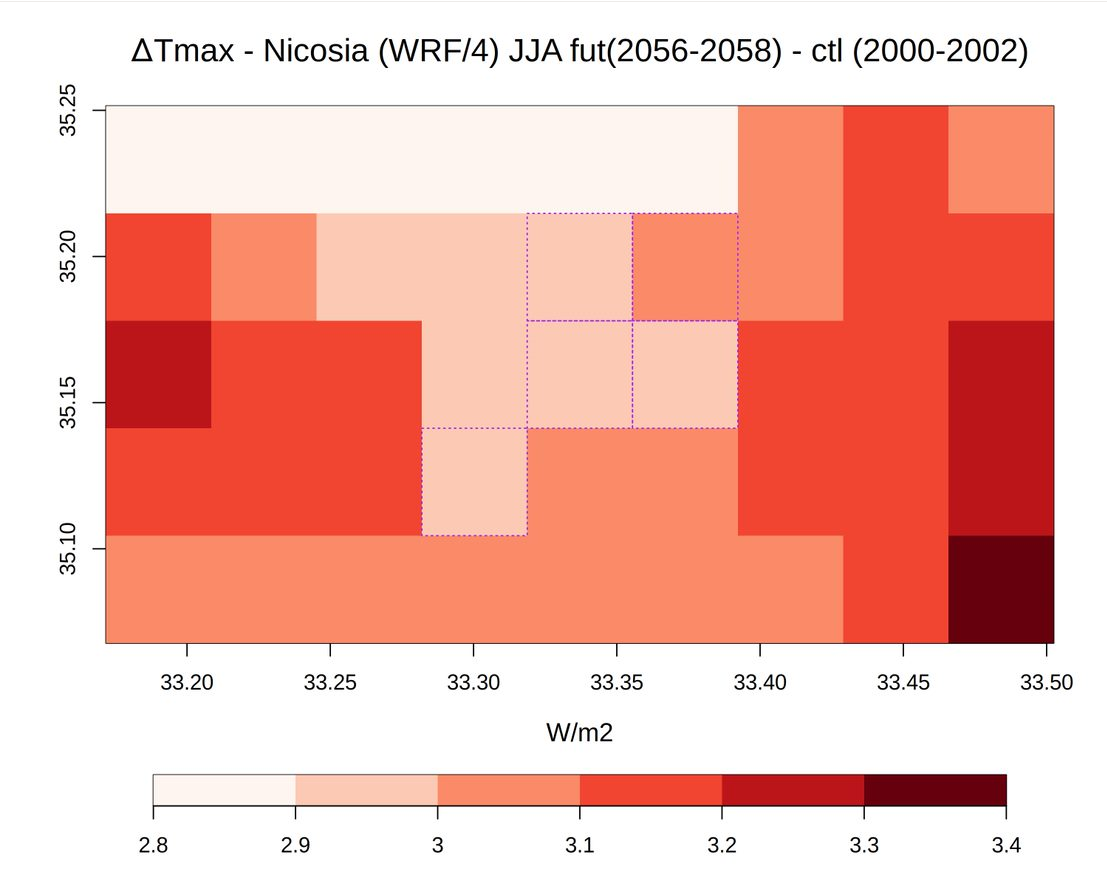
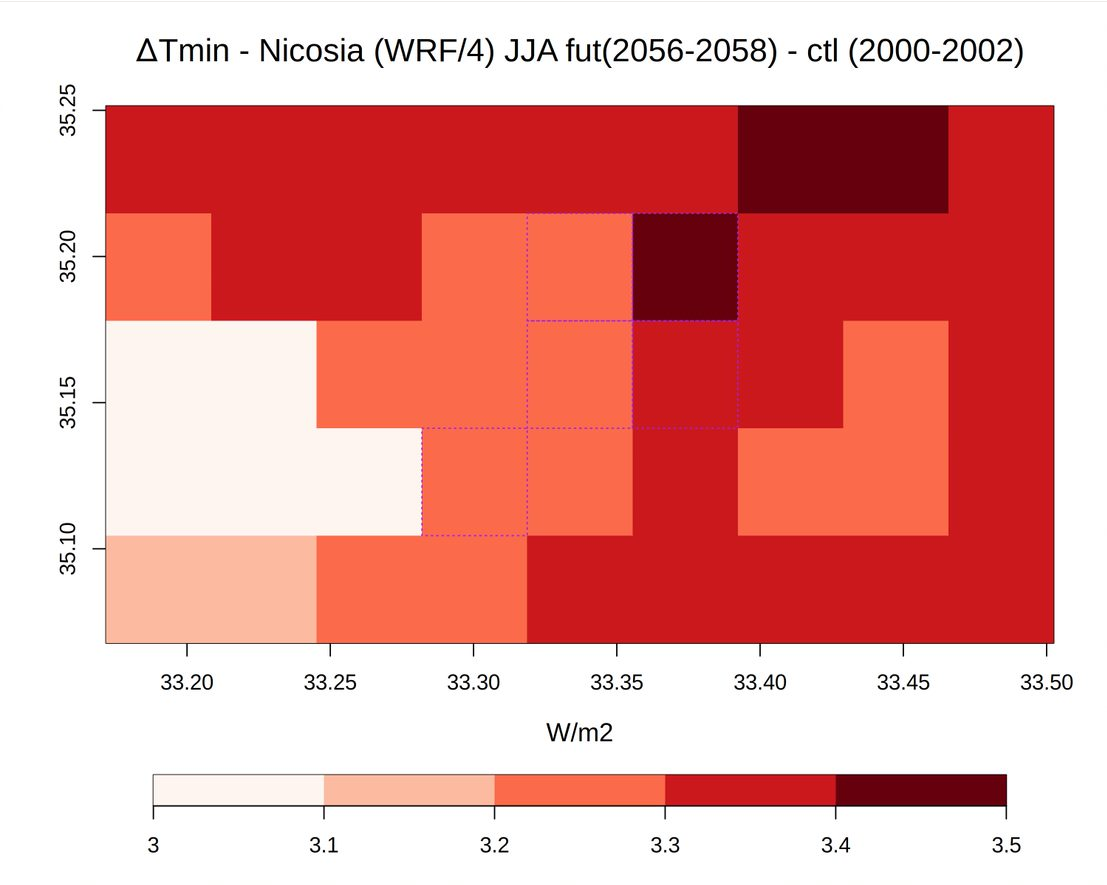
Below: Projected change in summer Maximum temperature (ΔTmax) and Minimum temperature (ΔTmin) calculated as the difference between a period (2056-2058) under the 3°C global warming level and the reference period (2000-2002), simulated by the WRF model over 4 km horizontal resolution. The dashed purple lines delineate the urban gridboxes in the model which represent Nicosia.
LIMASSOL
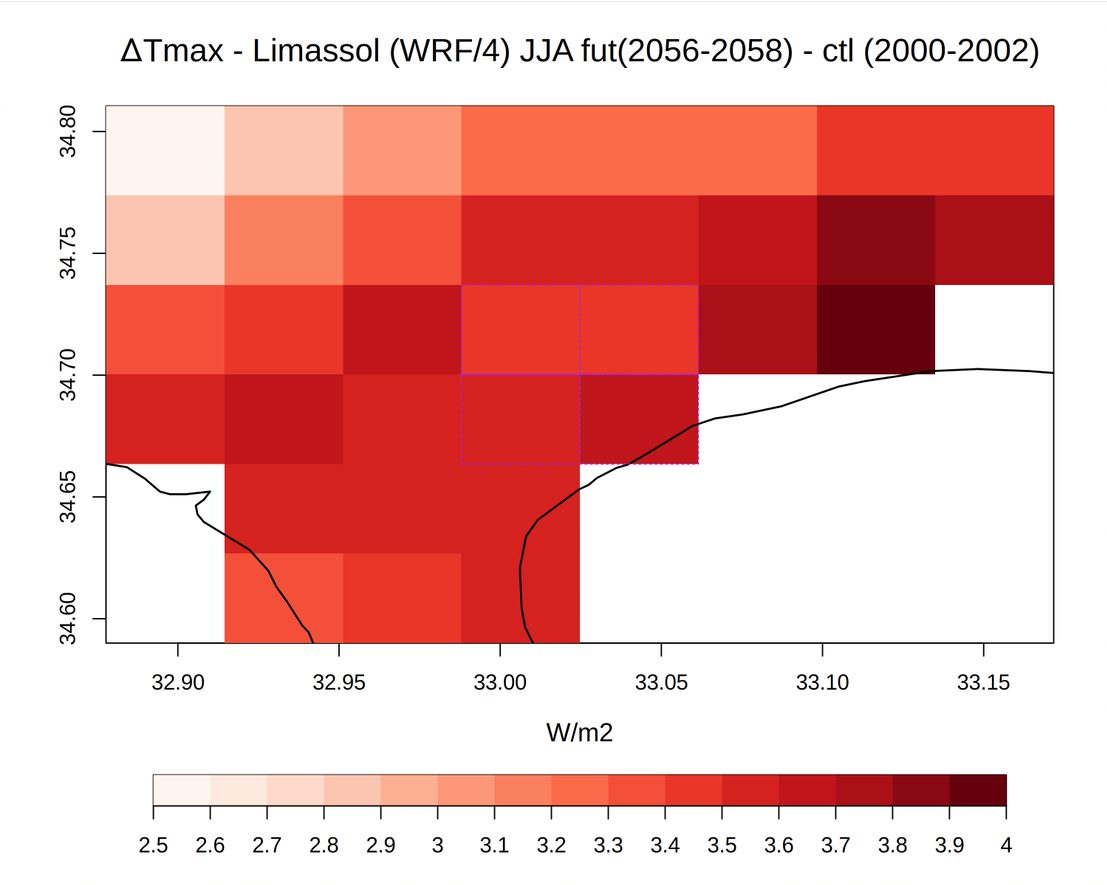
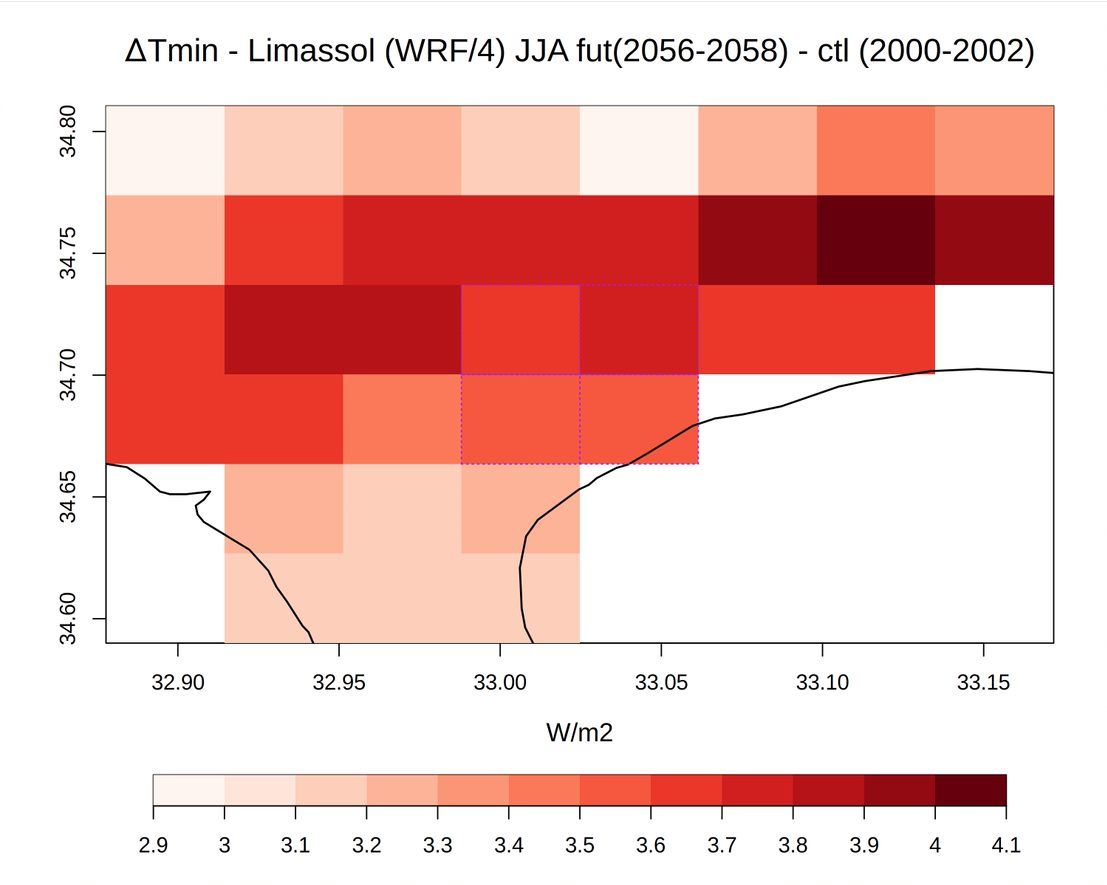
Below: Projected change in summer Maximum temperature (ΔTmax) and Minimum temperature (ΔTmin) calculated as the difference between a period (2056-2058) under the 3°C global warming level and the reference period (2000-2002), simulated by the WRF model over 4 km horizontal resolution. The dashed purple lines delineate the urban gridboxes in the model which represent Limassol.
CAIRO
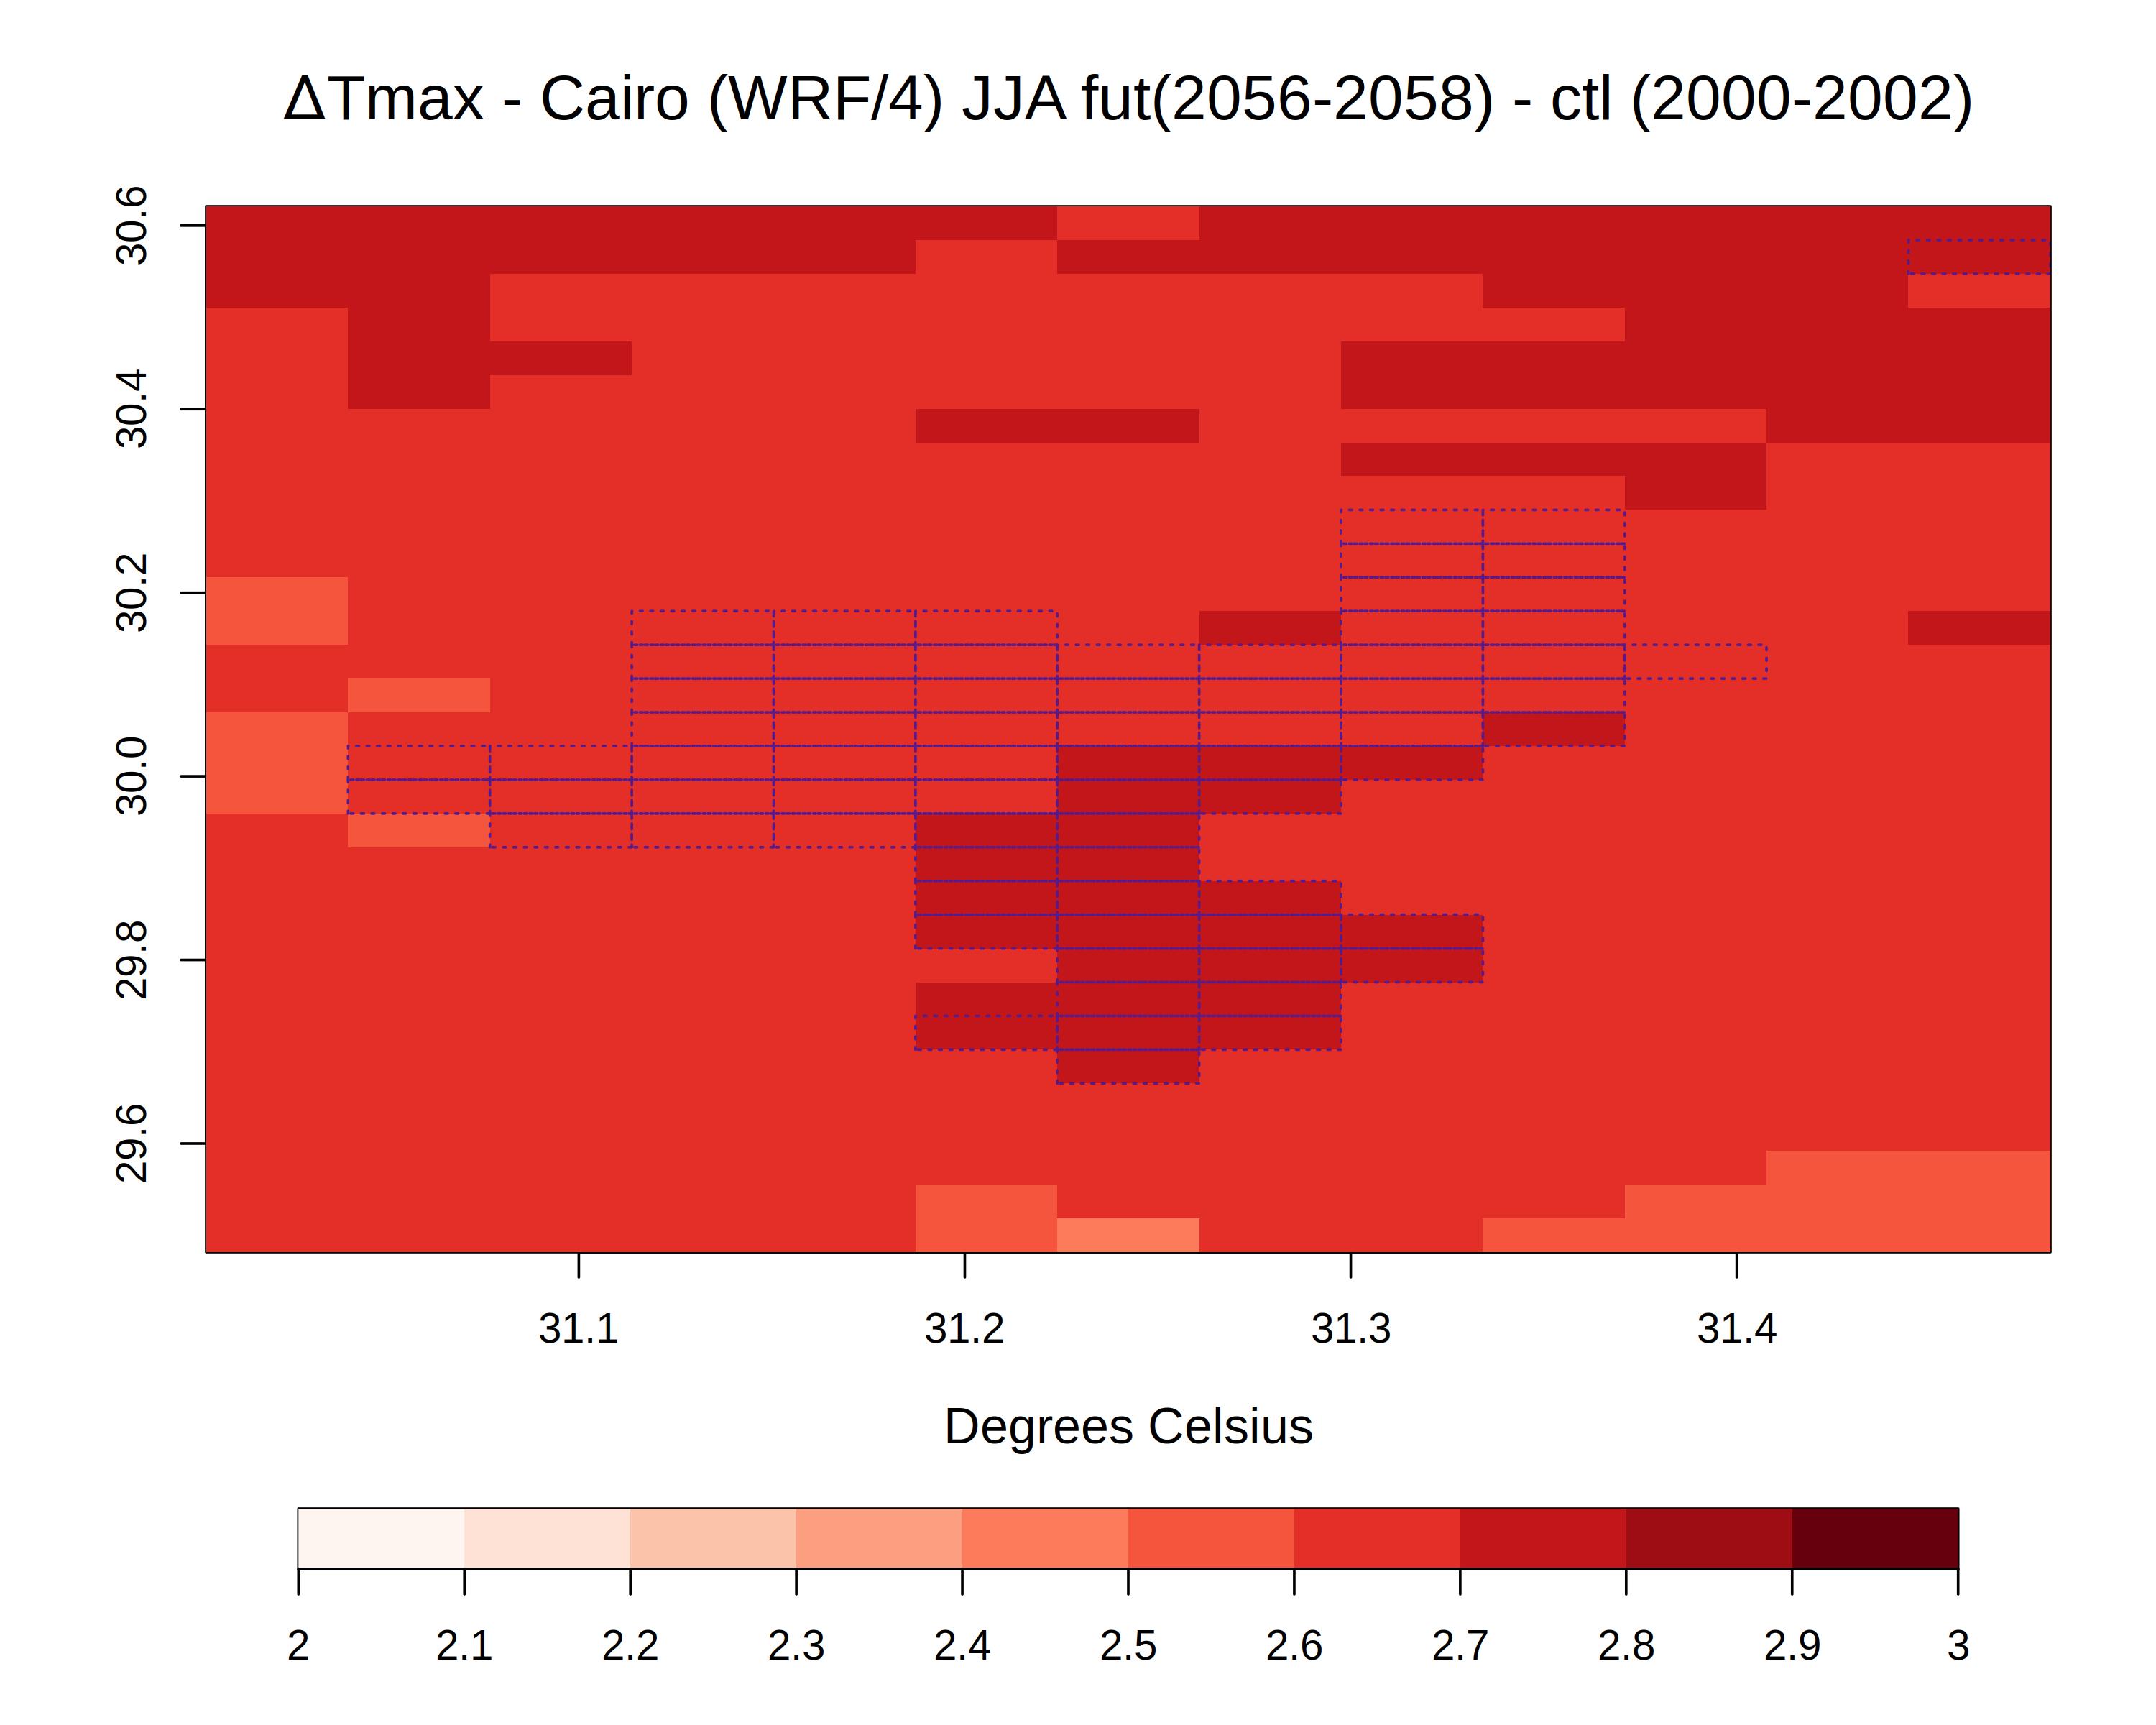
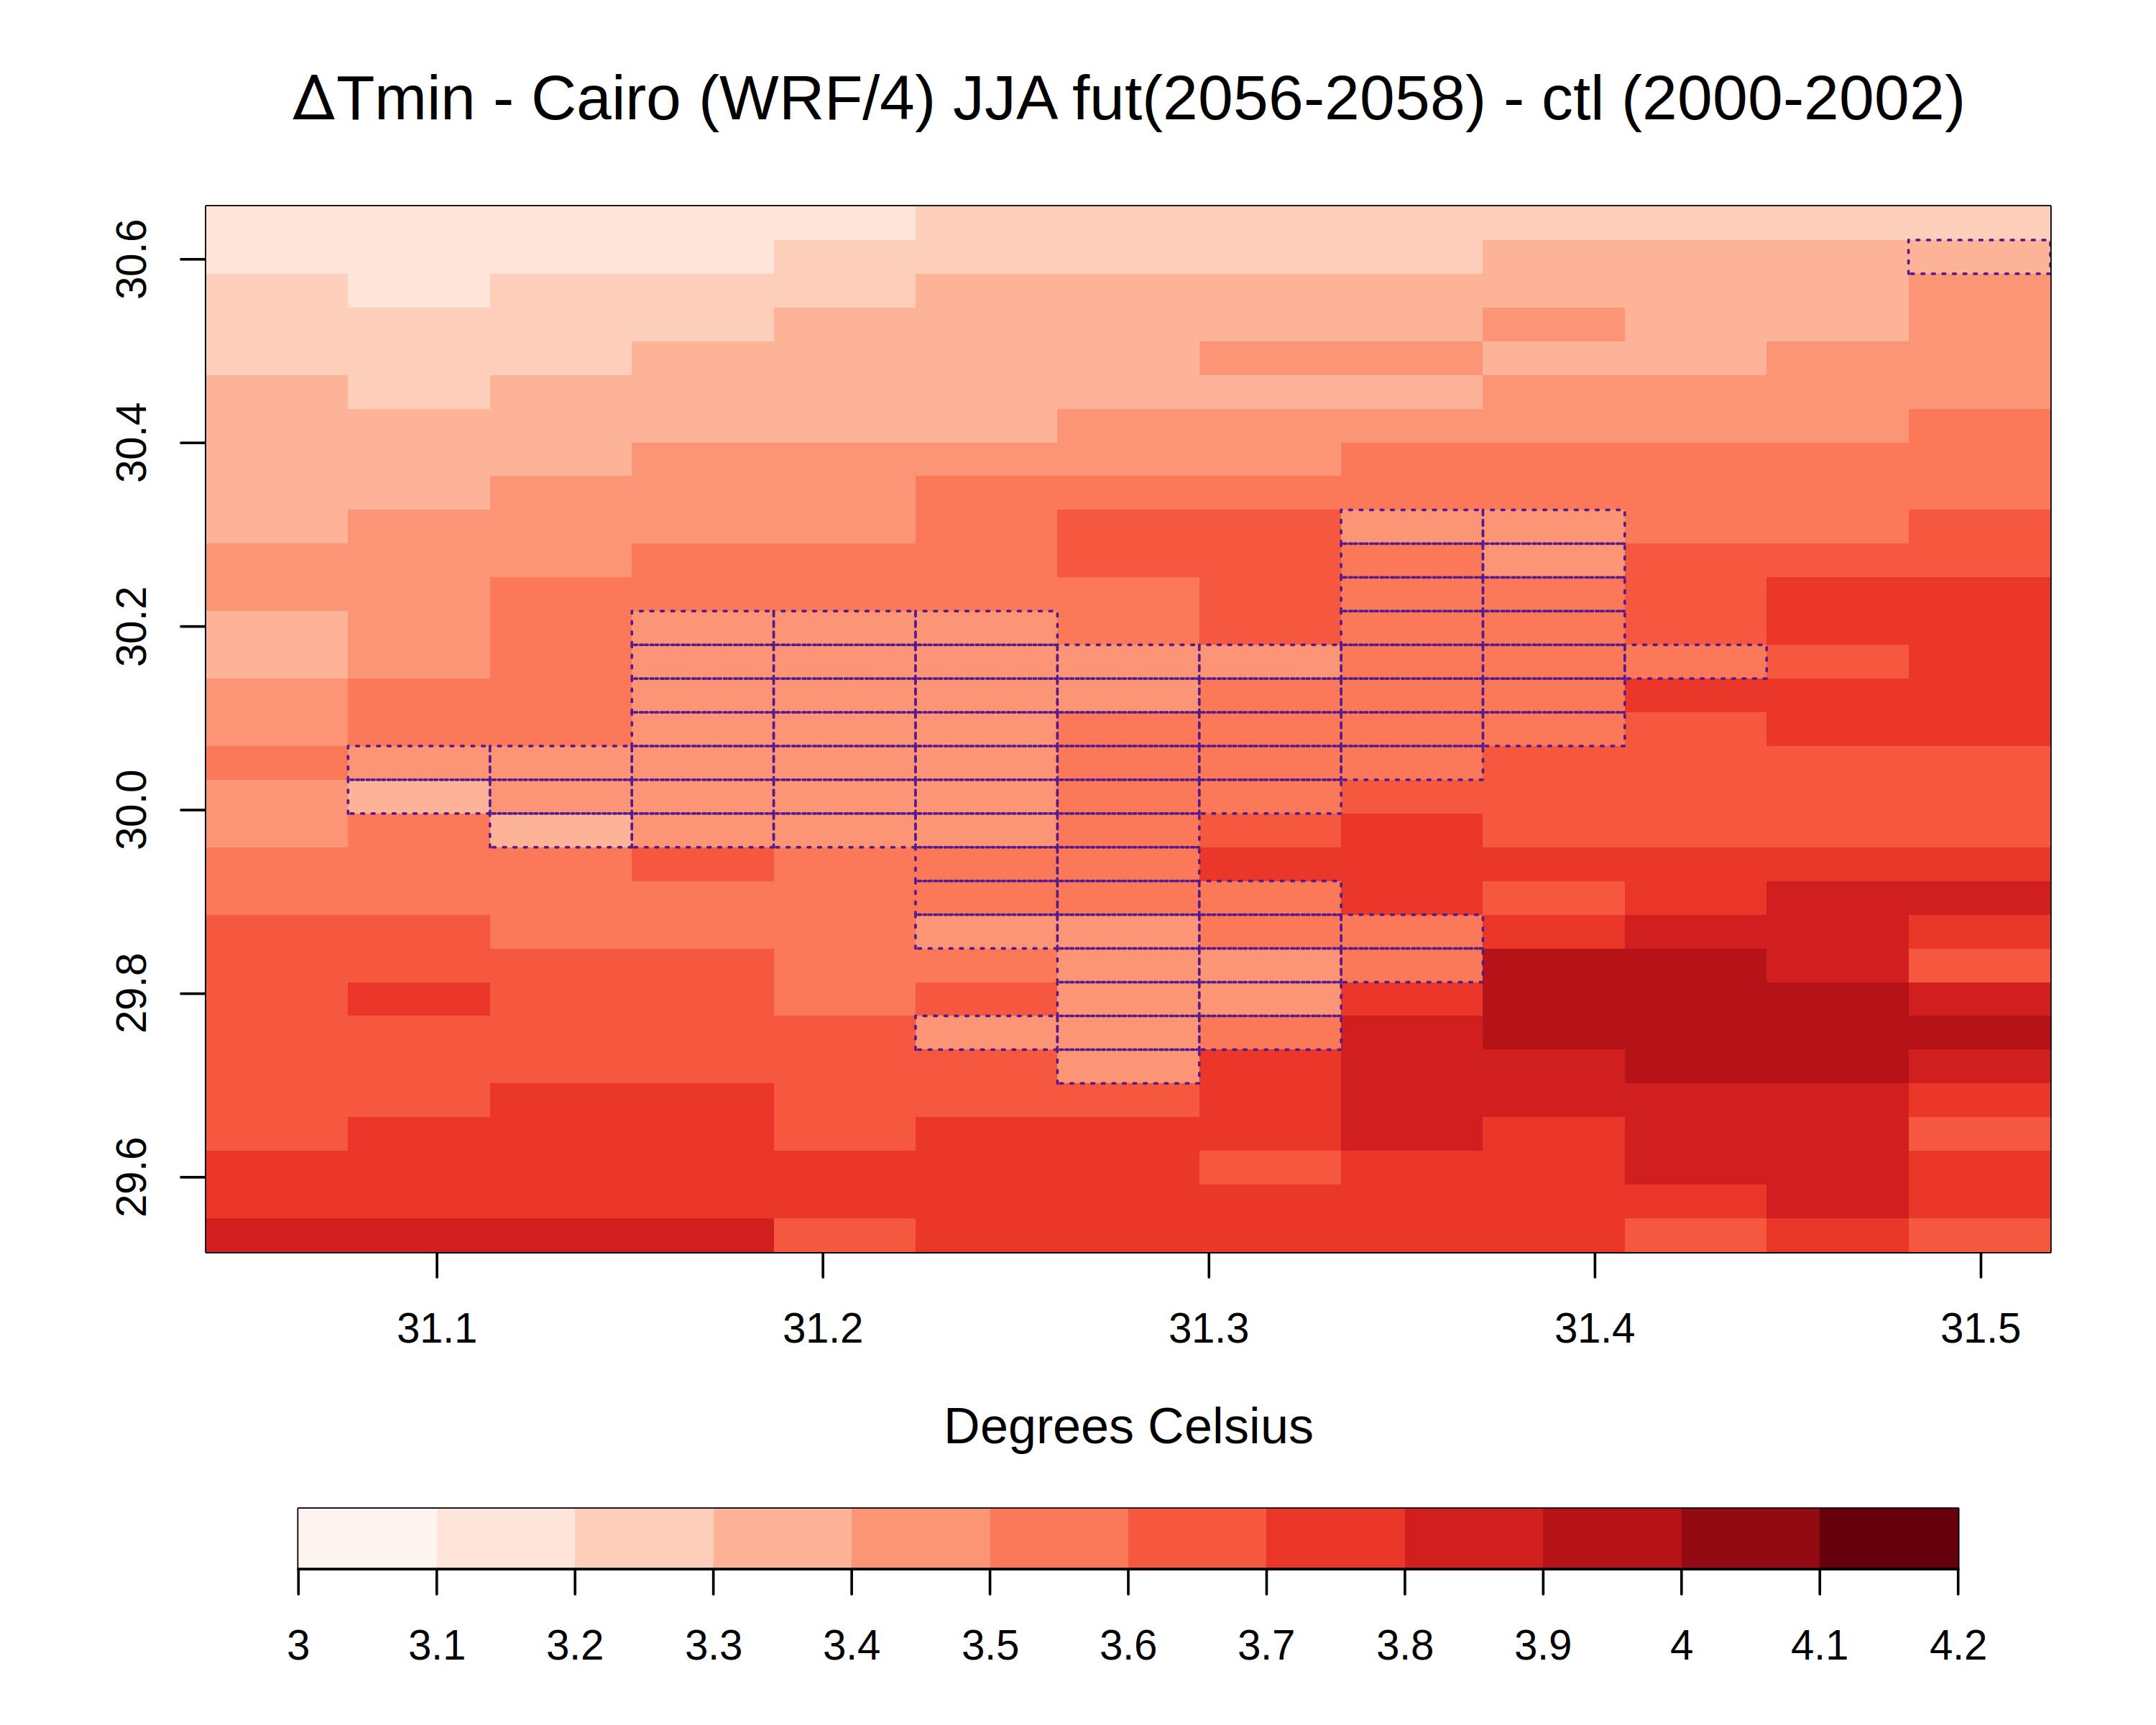
Below: Projected change in summer Maximum temperature (ΔTmax) and Minimum temperature (ΔTmin) calculated as the difference between a period (2056-2058) under the 3°C global warming level and the reference period (2000-2002), simulated by the WRF model over 4 km horizontal resolution. The dashed purple lines delineate the urban gridboxes in the model which represent Cairo.
